Analytics & Reporting
All plans on Checkout Components get access to insights on how their upsell components and products are performing.
desc - Track upsell performance with detailed analytics on revenue, orders, and product metrics.

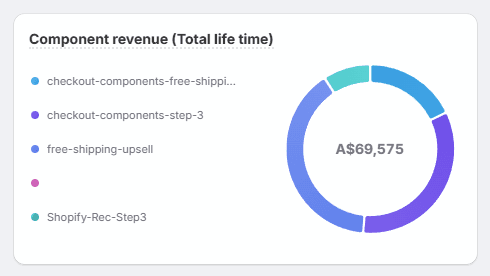
Component revenue (Total life time)
Upsell revenue generated by each component within the selectewd time period.
This chart provides an at-a-glance overview of the revenue generated by the app and breaks it down by each upsell component. It is interactive, allowing merchants to see exactly how much each part (e.g., checkout steps, free shipping offers, recommendations) contributes to the overall upsell revenue. This helps store owners quickly identify the most effective components, optimize their setup, and track how the app is boosting sales over time.
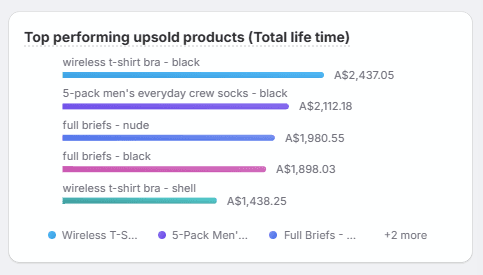
Top performing upsold products (Total life time)
Top 5 products that are generating the most revenue in your upsell components.
This chart highlights the top-performing products being upsold through the app, sorted by total lifetime revenue. It gives merchants a quick overview of which items customers are most likely to add on at checkout and how much each item contributes to their overall upsell performance. This insight helps in pinpointing winning products and adjusting upsell strategies accordingly.
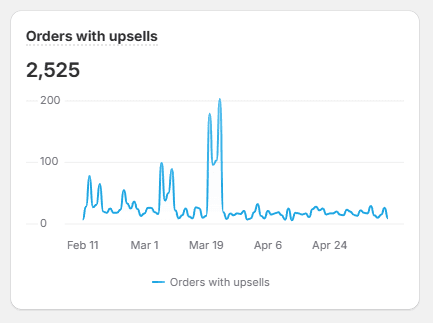
Total Orders with Upsold Products
The total number of orders that contain at least one upsold product via your Checkout Components.
This metric shows how many orders include at least one upsold item, in the selected time period. It helps merchants see how often their customers are accepting upsell offers.
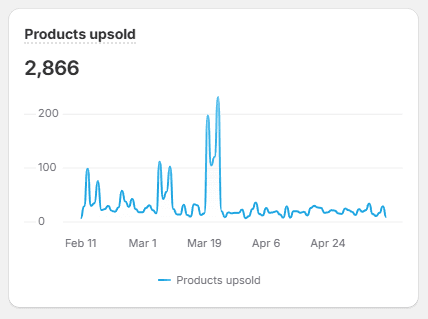
Total Products Upsold
Number of products that were purchased that were added to cart by via Checkout Components. This includes orders that contain multiple upsold products.
This figure counts the total number of individual upsold products sold during the selected time period. It reveals the overall volume of upsold items added to orders, giving insight into how frequently shoppers choose these extra products.
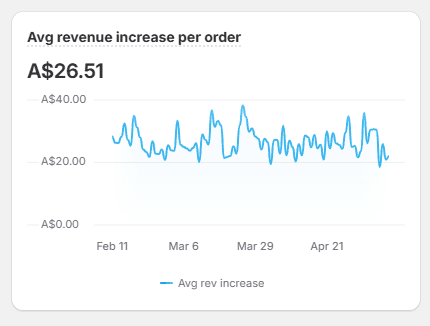
Average Revenue per Order
The average revenue generated from products that were added to cart by via Checkout Components across all orders.
This metric calculates the average upsell revenue generated per order for the selected time period. It indicates how effectively upsells are increasing the average order value, helping merchants evaluate the impact of their upsell strategies.